Understanding Phasor Diagrams
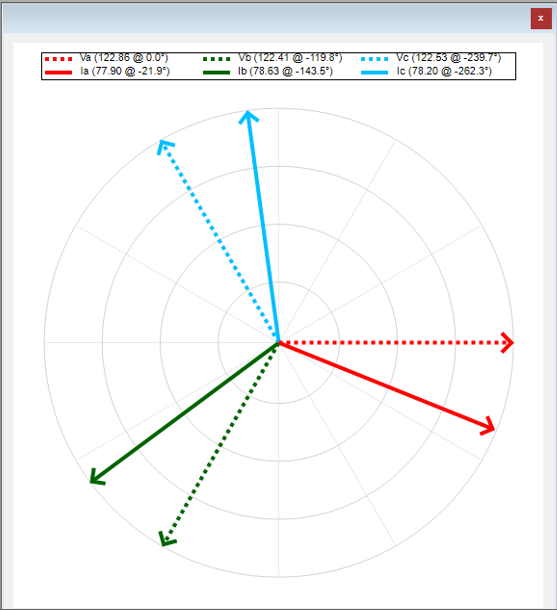
The phasor diagram represents the voltage and current phasors for a three-phase electrical system. Here’s a general guide for understanding and documenting the diagram:
Key Components of the Phasor Diagram
-
Voltage Phasors:
- Va (Red Solid Line): Represents Phase A voltage.
- Vb (Green Solid Line): Represents Phase B voltage.
- Vc (Blue Solid Line): Represents Phase C voltage.
-
Current Phasors:
- Ia (Red Dotted Line): Represents Phase A current.
- Ib (Green Dotted Line): Represents Phase B current.
- Ic (Blue Dotted Line): Represents Phase C current.
Interpretation
- Voltage Phasors: These are represented as solid lines, indicating the three-phase system's voltages, with their respective magnitudes and phase angles.
- Current Phasors: These are represented as dotted lines and correspond to the currents for each phase.
- Angle Reference: Phase A voltage (Va) is used as the reference with 0° phase angle.
- Phase Relationships: The phase angles demonstrate the typical 120° phase shift between each phase for a balanced three-phase system. Any deviation indicates an imbalance.
- Magnitude: The magnitude of the phasors is proportional to their amplitude in the system.
Documentation Details
-
Title: Phasor Diagram for Three-Phase Voltage and Current
-
Legend:
- Solid Lines: Voltage Phasors (Va, Vb, Vc)
- Dotted Lines: Current Phasors (Ia, Ib, Ic)
-
Units:
- Voltage Magnitude: Typically measured in volts (V).
- Current Magnitude: Typically measured in amperes (A).
- Phase Angle: Measured in degrees (°).
-
Key Observations:
- The phase angles between the voltages and currents indicate the power factor and the type of load (resistive, inductive, or capacitive).
- The diagram highlights any phase imbalance if the angles or magnitudes deviate significantly from expected values.
-
Applications:
- Analysis of three-phase systems for load balancing.
- Detection of harmonic distortions or system anomalies.
- Power factor correction and energy efficiency optimization.
Example

-
Voltage Phasors:
- Va (Red Solid Line): magnitude of 122.86 and an angle of 0°.
- Vb (Green Solid Line): magnitude of 122.41 and an angle of -119.8°.
- Vc (Blue Solid Line): magnitude of 122.53 and an angle of -239.7°.
-
Current Phasors:
- Ia (Red Dotted Line): magnitude of 77.90 and an angle of -21.9°.
- Ib (Green Dotted Line): magnitude of 78.63 and an angle of -143.5°.
- Ic (Blue Dotted Line): magnitude of 78.20 and an angle of -262.3°
Therefore, the power factor is (cosine of angle between voltage and current:
- PFa => cos(0° - (-21.9°)) => cos(21.9°) = 0.9278
- PFb => cos (-119.8° - (-143.5°)) => cos (23.8°) = 0.9146
- PFc => cost (-239.7° - (-262.3°)) => cos (22.6) = 0.9232